Enabling diagnostic settings is a fundamental requirement for deploying services on Azure. Each type of resource has a different set of log and metric categories. It could get quickly complicated and clunky if you don’t use a dynamic way to fetch those log and metric categories. However, before we open the floodgates, we also need to be mindful of the associated cost of sending all the logs to various destinations. You need a way to capture logs that are “just enough” to effectively troubleshoot and extract insights, while filtering out low-value, verbose logs.
In this blog post, I walk you through a Terraform module that will deploy diagnostic settings for Azure services in a dynamic way, catering to different log destinations and providing the ability to turn off storage for unnecessary logs and metrics.
The following log destinations are covered:
- Log analytics workspace
- Azure storage
- Event hub
You can use any combination of these destinations, but at least one must be selected. Each destination offers different advantages. Sending logs to a log analytics workspace lets you query the log data using the powerful KQL language to gather insights. The Log Analytics workspace also offers a long-term storage option of up to 12 years. Azure storage doesn’t give you querying capabilities, but it gives you long-term log storage at a lower cost, usually used for archival purposes. It is a common pattern to send logs to an Event Hub as a way to integrate with a third-party SIEM like Splunk.
Implementation
Creating the prerequisites
The code below shows the creation of all the services that are required as input for the monitoring module. These are the log destinations. I have used a basic sku for these services as I wanted to reduce cost, but you can choose whichever sku that makes sense for your particular scenario.
resource "azurerm_storage_account" "this" {
  name                     = "<account name>"
  resource_group_name      = var.resource_group_name
  location                 = var.location
  account_tier             = "Standard"
  account_replication_type = "LRS"
}

resource "azurerm_log_analytics_workspace" "this" {
 name                = "<workspace name>"
 location            = var.location
 resource_group_name = var.resource_group_name
 sku                 = "PerGB2018"
}


resource "azurerm_eventhub_namespace" "this" {
  name                = "<namespace name>"
  location            = var.location
  resource_group_name = var.resource_group_name
  sku                 = "Basic"
}

resource "azurerm_eventhub" "this" {
  name                = "<eventhub name>"
  namespace_id      = azurerm_eventhub_namespace.this.id
  partition_count     = 2
  message_retention = 1
}

resource "azurerm_eventhub_namespace_authorization_rule" "this" {
  name                = "<eventhub rule name>"
  namespace_name      = azurerm_eventhub_namespace.this.name
  resource_group_name = var.resource_group_name

  listen = true
  send   = true
  manage = false
}
The module will be used to deploy diagnostic settings for two existing resources – a Storage Account and a Key Vault. The details of these resources will be accessed via two data blocks.
data "azurerm_storage_account" "targetstorage" {
  name                = "<storage account name>"
  resource_group_name = "<resource group name>"
}

data "azurerm_key_vault" "targetkeyvault" {
  name                = "<key vault name>"
  resource_group_name = "<resource group name>"
}
Monitoring module
Let us now look at the monitoring module’s main.tf. The azurerm_monitor_diagnostic_categories data block dynamically gets all the log and metric categories, so that you don’t have to specify each and every category that needs to be captured. Once you enable diagnostic settings, all the logs will be pumped into the chosen destinations. You may want to save on costs by turning off sending a category of log or metric to the destination by using the two variables – exclude_log_categories and exclude_metric_categories. The monitoring module will then ignore those categories and enable the rest by using two dynamic blocks and looping over the active_log_categories and the active_metric_categories local variables.
data "azurerm_monitor_diagnostic_categories" "this" {
  resource_id = var.resource_id
}

locals {
  active_log_categories = [for item in data.azurerm_monitor_diagnostic_categories.this.log_category_types : item if !contains(var.exclude_log_categories, item)]
  active_metric_categories = [for item in data.azurerm_monitor_diagnostic_categories.this.metrics : item if !contains(var.exclude_metric_categories, item)]
}

resource "azurerm_monitor_diagnostic_setting" "this" {
  name                       = "diagsetting${var.environment}"
  target_resource_id         = var.resource_id
  storage_account_id = var.enable_storage ? var.storage_account_id : null
  log_analytics_workspace_id = var.enable_log_analytics ? var.log_analytics_workspace_id : null
  eventhub_name = var.enable_eventhub ? var.eventhub_name : null
  eventhub_authorization_rule_id = var.enable_eventhub ? var.eventhub_authorization_rule_id : null

dynamic "enabled_metric" {
    for_each = toset(local.active_metric_categories)
    content {
      category = enabled_metric.key
    }
  }
dynamic "enabled_log" {
    for_each = toset(local.active_log_categories)
    content {
      category = enabled_log.key
    }
  }
}
Shown below are the monitoring module’s variables.
variable "environment" {
  type = string
}

variable "resource_id" {
  type = string
}

variable "exclude_metric_categories" {
  type    = list(string)
}

variable "exclude_log_categories" {
  type    = list(string)
}

variable "enable_eventhub" {
  type    = bool
  default = false
}

variable "enable_log_analytics" {
  type    = bool
  default = false
}

variable "enable_storage" {
  type    = bool
  default = false
}

variable "storage_account_id" {
    type = string
    default = null
    validation {
      condition = var.enable_storage == false || (var.enable_storage == true && var.storage_account_id != null)
      error_message = "storage_account_id must be provided if enable_storage is true."
    }
}

variable "log_analytics_workspace_id" {
    type = string
    default = null
    validation {
      condition = var.enable_log_analytics == false || (var.enable_log_analytics == true && var.log_analytics_workspace_id != null)
      error_message = "log_analytics_workspace_id must be provided if enable_log_analytics is true."
    }
}

variable "eventhub_name" {
  type = string
  default = null
  validation {
    condition = var.enable_eventhub == false || (var.enable_eventhub == true && var.eventhub_name != null)
    error_message = "eventhub_name must be provided if enable_eventhub is true."
  }
}

variable "eventhub_authorization_rule_id" {
  type = string
  default = null
  validation {
    condition =  var.enable_eventhub == false || (var.enable_eventhub == true && var.eventhub_authorization_rule_id != null)
    error_message = "eventhub_authorization_rule_id must be provided if enable_eventhub is true."
  }
}
Below are the contents of the root module’s variables.tf.
variable "subscription_id" {
  type    = string
  default = "<subscription id>"
}

variable "location" {
  description = "The Azure Region to deploy resources in."
  type        = string
  default     = "<location>"
}

variable "resource_group_name" {
  description = "The name of the Resource Group to create the resources in."
  type        = string
  default     = "<Resource group to deploy the prerequisite resources>"
}
Calling the monitoring module
The code below shows the invocation of the monitoring module three times – once for the Azure Storage Account, next for the Storage Account blob service, and last for the Key Vault service.
module "storagediagnosticsetting" {
source = "./modules/monitoring"
environment = "dev"
resource_id = data.azurerm_storage_account.targetstorage.id
exclude_metric_categories = ["Capacity"]
exclude_log_categories = []
enable_log_analytics = true
enable_eventhub = true
log_analytics_workspace_id = azurerm_log_analytics_workspace.this.id
eventhub_name = azurerm_eventhub.this.name
eventhub_authorization_rule_id = azurerm_eventhub_namespace_authorization_rule.this.id
}
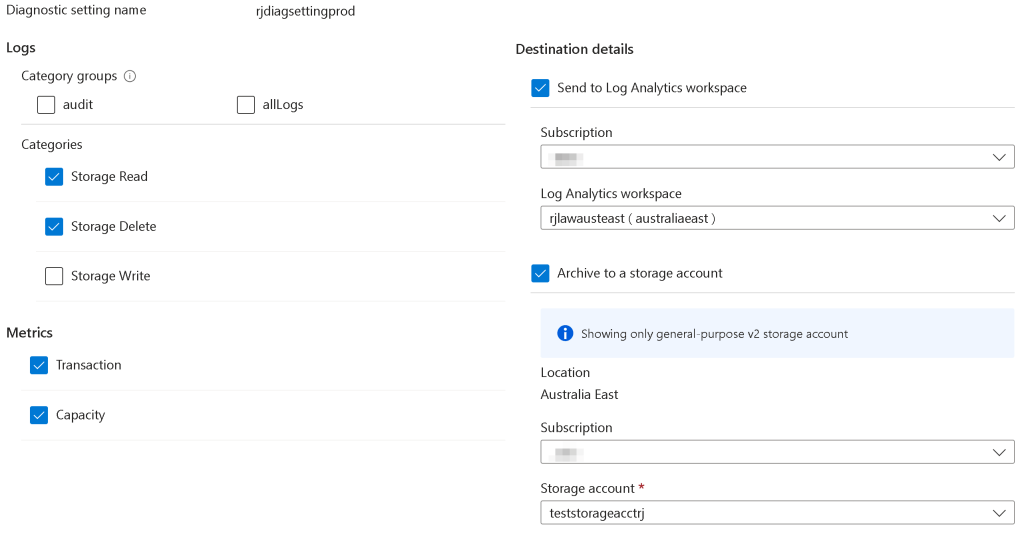
module "storageblobdiagnosticsetting" {
source = "./modules/monitoring"
environment = "prod"
resource_id = "${data.azurerm_storage_account.targetstorage.id}/blobServices/default"
exclude_metric_categories = []
exclude_log_categories = ["StorageWrite"]
enable_storage = true
enable_log_analytics = true
enable_eventhub = true
storage_account_id = azurerm_storage_account.this.id
log_analytics_workspace_id = azurerm_log_analytics_workspace.this.id
eventhub_name = azurerm_eventhub.this.name
eventhub_authorization_rule_id = azurerm_eventhub_namespace_authorization_rule.this.id
}
module "keyvaultdiagnosticsetting" {
source = "./modules/monitoring"
environment = "prod"
resource_id = data.azurerm_key_vault.targetkeyvault.id
exclude_metric_categories = []
exclude_log_categories = ["AuditEvent"]
enable_storage = true
storage_account_id = azurerm_storage_account.this.id
}
You can enable/disable a log destination by setting the corresponding boolean variables to true and providing the required values for that destination type. For example, if you want to send your logs to a log analytics workspace only, set enable_log_analytics to true and log_analytics_workspace_id to the workspace that you created. It is best to avoid duplication when setting log destinations.
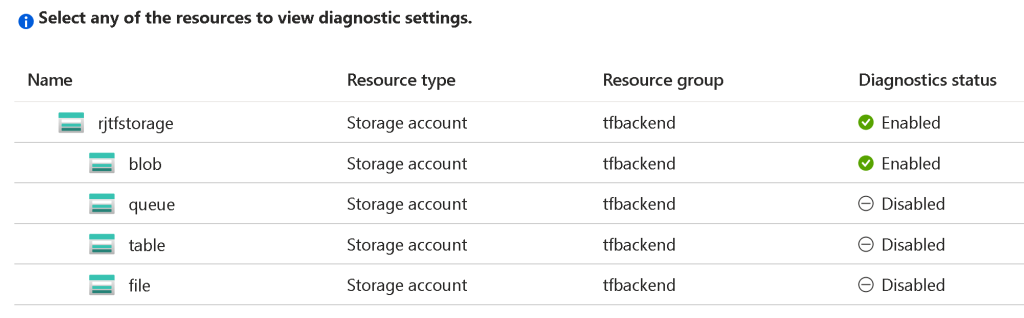
Results
Once you execute the terraform init and terraform apply commands, the diagnostic settings will be configured for the storage account and key vault. Here are some screenshots showing the results of the module execution for Azure Storage.